Help Desk
Understanding Standard Scores
There are many ways to report scores from a test starting with raw scores (the actual number the person scored) and percentages (percentage correct), both of which are about the relationship between the individual and the test items. This is, if you like, a form of criterion-based reporting.
However, of greater interest in most cases is how well an individual did compared to a wider population. For this you need to have “test norms” which usually means large numbers of results for each age band. On these pages, we try to explain how they work, and why they are great for classroom practice. Standards scores may be seen as a way to
- Compare children within a class
- Compare children from different classes and schools
- Compare children of different ages
- Compare results from different versions of tests (e.g. spelling)
- Compare results from different assessments (e.g. spelling and rhyming)
Once you have the standard scores you can use them to identify highs and lows in the pupil profile, to develop appropriate interventions targeting the (evidence-based) most important areas, and setting appropriate targets. They will also help you set priorities in terms of which pupils need help, and allow you to not only support the low achievers, but also note and set appropriate targets for high achievers.
How to calculate standard scores
Calculation of standard scores is relatively simple. You set 100 for the mean, and 15 points for each standard deviation. Thus somebody who is two standard deviation above the norm will have a score of 130, and somebody who is three standard deviations below the norm will have a score of 55. However, there is an underlying assumption of a normal distribution.
Where the distribution is not normal (e.g. skewed due to ceiling effects, floor effects, the nature of the test items or idiosyncrasies in the norming population) it is possible to use percentile ranks which can be more effective than standard deviations (or z-scores).
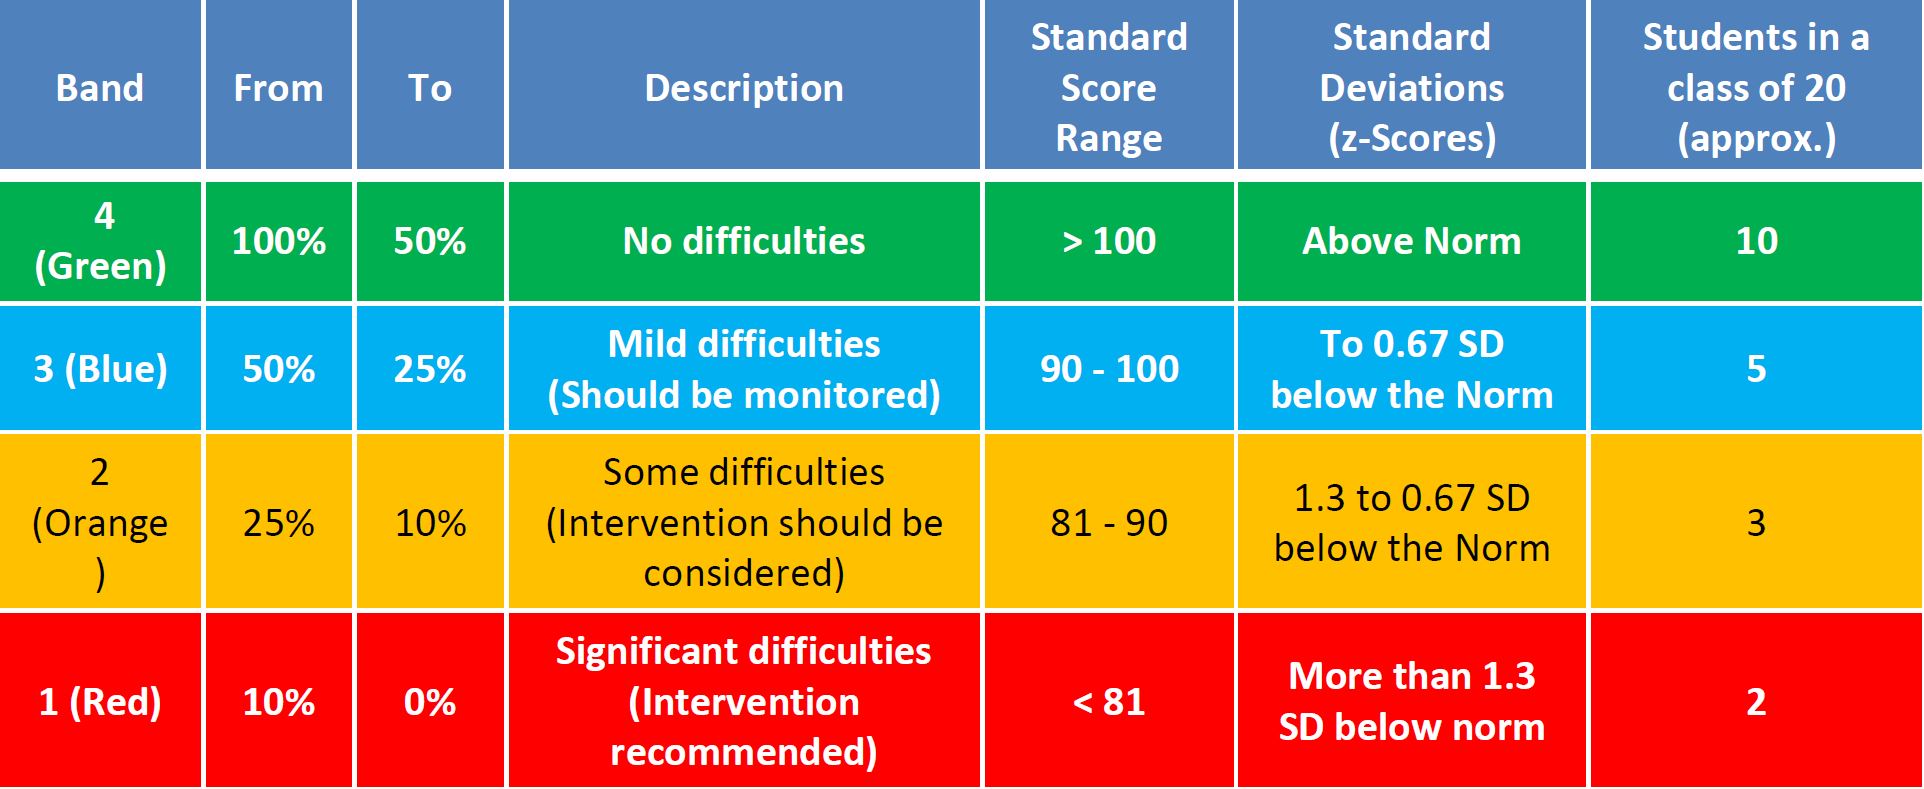
Understanding Profiler bands
In many instances a quick visual reference is better than trying to relate numbers to skills. For this reason, we developed the Bands approach for Profiler, where each student is allocated to one of four bands. Their relationship to other metrics is shown in the table below.
This allows teacher, tutors and others supporting students and allocating resources to quickly identify those who fall into each of these groups. This method is used throughout Profiler where robust norms are available.
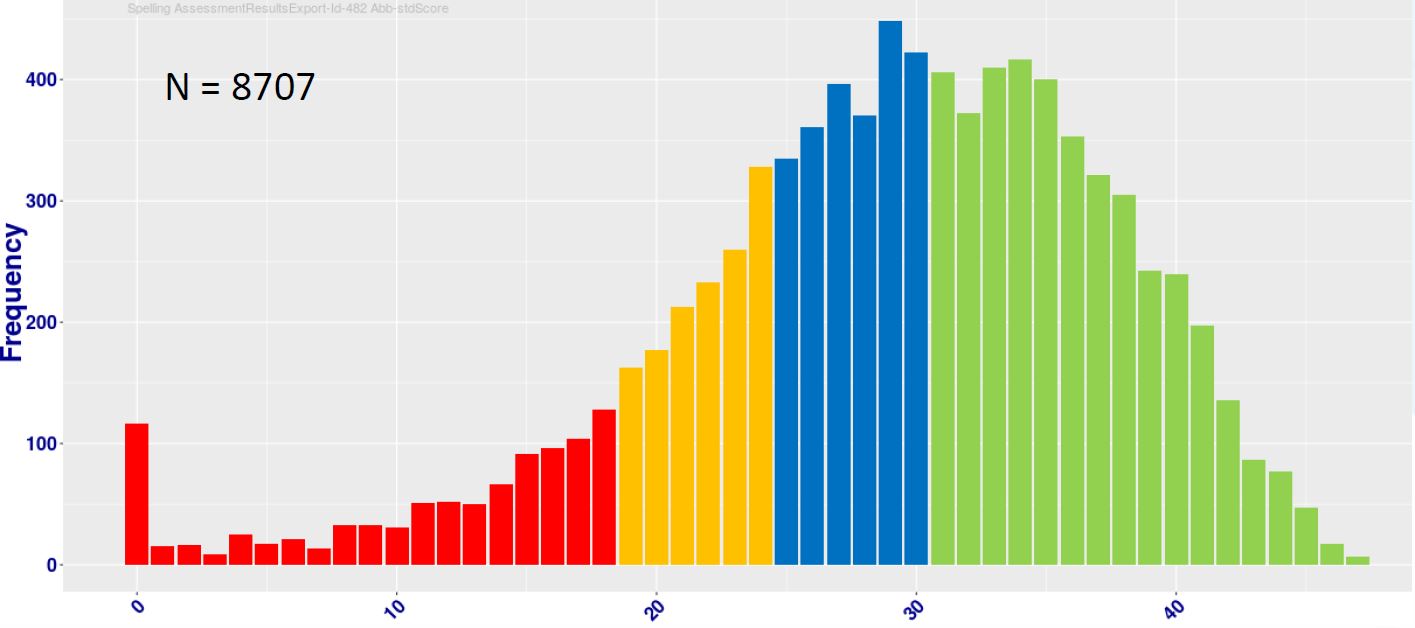
Graph of Raw Scores
The graph shows results for spelling from 8707 students. It shows a normal distribution (though a blip at zero) with only a slight skew. Colours indicate another form of grouping within Profiler – Bands. See the guide on the previous page for details.
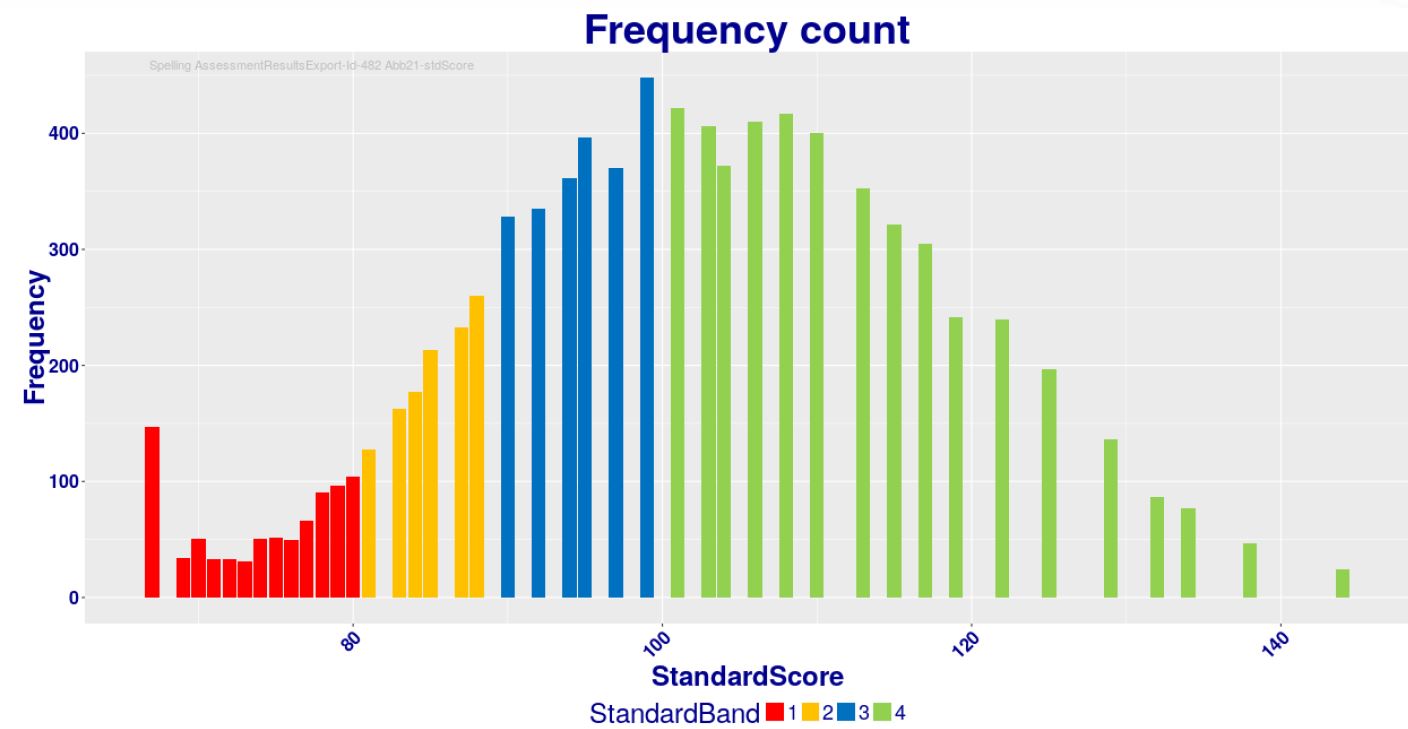
Graph of Standard Scores
Note that in converting to Standard Score there are often more numbers than when using Raw Scores. For this reason, there are apparent gaps, where nobody scores that value.
Using Standard Scores in Profiler
Everybody has their own preference when reading reports. Some prefer the bare numbers, some like text, and others find it easier to have a visual representation. In Profiler, we offer all forms.
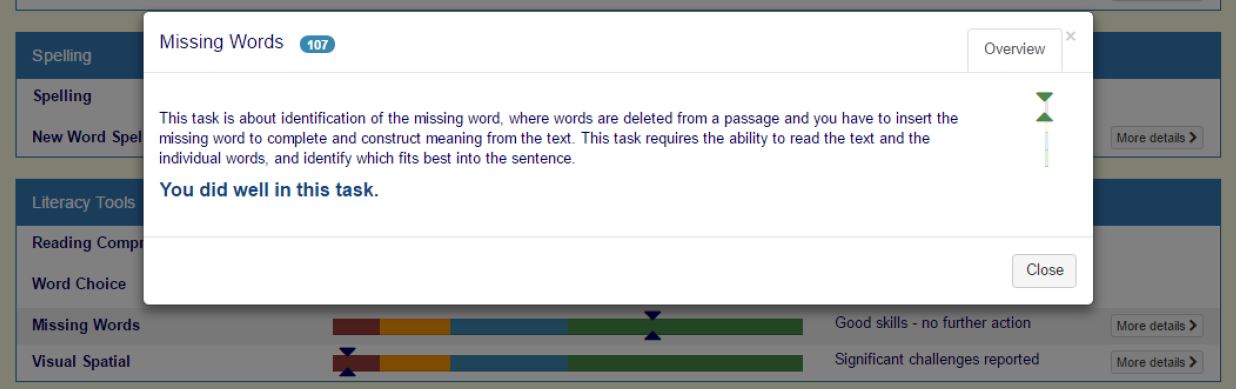
In the above illustration you can see the online report with the popup which appears when you click “More details”. This provides the details of the test, the Standard Score, and your feedback. Beneath that you can see the bar that indicates your Band and Standard Score.
Need to contact us?
If you can't find what you are looking for using our online documentation, please use the contact details below to contact us and we'll do our best to help you with your query.
Telephone: 020 33 22 55 36Email: helpdesk@doitprofiler.net